
In the fiscal year ending on September 30, 2022, the federal government spent over six trillion dollars on providing goods, services, and payments to Americans. Much of this spending was on national defense and expenditures known as entitlement programs such as Social Security and Medicare (for details on these programs, see the briefs listed in the For Further Reading section). The rest of the budget, almost a trillion dollars every year, is discretionary spending, covering everything from law enforcement and road building to foreign aid and education. What do Americans get for this substantial annual expenditure?
What are the major components of discretionary spending?
Federal discretionary spending pays for much of what the government does outside of defense and entitlement programs. This spending is “discretionary” because the spending levels for these programs are set each year in the budget enacted by Congress. There is nothing preventing politicians from eliminating any or all discretionary spending – or increasing it to whatever levels they or their constituents want.
The chart below shows the major components of discretionary spending for the fiscal year ending on September 30, 2022. 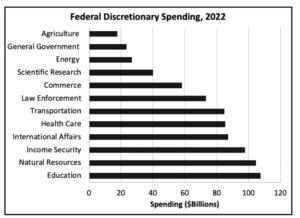
The categories illustrate the wide range of activities performed by federal agencies:
- Agriculture includes payments to farmers as well as food assistance to the poor.
- General government programs pay for administrative staff as well as salaries for elected officials.
- Science and technology programs include NASA (National Aeronautics and Space Administration) and other agencies such as NSF (National Science Foundation).
- Commerce spending covers enforcement of tariffs and trade regulations as well as efforts to promote economic development.
- Law enforcement funding pays for federal law enforcement including border control.
- Transportation spending covers federal programs to build and maintain roads and bridges as well as the Federal Aviation Agency.
- Community development programs pay for grants to local cities and towns throughout the United States.
- Health spending funds the Centers for Disease Control and other public health initiatives.
- International affairs programs include direct foreign aid to other nations as well as contributions to the United Nations and other international agencies.
- Income security programs include the federal government’s contribution to state and local welfare agencies.
- Natural resource and environment spending funds agencies such as the US Forest Service and the Environmental Protection Agency.
- Education funding includes aid to elementary and secondary schools as well as universities and vocational programs.
How has discretionary spending changed over time?
The figure below shows that as a percentage of GDP (Gross Domestic Product, which measures the size of the US economy), federal discretionary spending has remained relatively constant over time, amounting to about 6 – 4% of GDP for the past forty years. In general, discretionary spending has stayed the same or even declined over this time.

The two exceptions to the overall flat trend in discretionary spending both involved a response to emergencies. In 2009-11, federal spending increased in response to the 2008 financial crisis, including subsidies to businesses and economic stimulus spending on roads, bridges, and other infrastructure. The more recent spike in discretionary spending involved expansions of health care programs and economic stimulus in response to the COVID pandemic.
What parts of discretionary spending are smaller than generally thought?
One of the most important features of the discretionary spending chart is the finding that federal spending in some areas is much smaller than commonly believed. Consider international assistance. Total funding (not including military assistance) amounted to $71 billion dollars in 2022 – just over one percent of total federal spending. This funding includes programs to deliver health care, strengthen education, build democracy, assist refugees, and increase economic development.
Similarly, funding for science and technology research throughout the federal government amounted to $37 billion dollars – about one-half percent of total spending in 2022. Slightly more than half of this funding was for NASA, but additional funds were for programs such as the Energy Department’s general science program and the research on crop yields funded by the Department of Agriculture.
How much of discretionary spending goes to “waste, fraud, and abuse”?
One common complaint about federal spending is that the government spends too much money on programs of little merit. One response to this claim lies in the list of specific programs discussed earlier. For each one, it is easy to identify large groups of people who favor the program or directly benefit from its spending. The point is not that such support justifies the spending, but that the federal government does very few things that no one (or very few people) want.
One systematic analysis of possibly-wasteful government spending comes from the non-partisan organization Citizens Against Government Waste, who publishes the Congressional Pig Book, an annual list of budget items that were spent without being included in an earlier authorization resolution, were not requested by the President, and were not competitively awarded. Typically these programs were added to the budget by individual members to serve largely local interests. The Pig Book may overestimate the amount of waste in the federal budget, as it is likely that some of these programs are strongly supported by the public and provide important benefits. Even so, of the nearly one trillion dollars of discretionary spending in the earlier table, the Pig Book flags only about $16 billion dollars as potentially wasteful spending, or only about two percent of total discretionary spending.
How does federal discretionary spending compare to spending by states?
While federal discretionary spending has declined over the last generation, spending by state and local governments has increased. The following chart shows state and local governments spending as a percent of GDP since 1970. Over this time, spending has increased from about 10 percent of GDP to almost 14 percent.

Can discretionary spending be reduced?
In principle, discretionary spending is the easiest kind of spending to reduce. And for entitlement programs such as Social Security or Medicare, the government is required to budget as much as needed to deliver the program’s benefits as mandated by law. The only way to reduce entitlement spending is to change the underlying laws that define what beneficiaries receive from the programs. Discretionary programs, in contrast, have no mandated spending levels – members of Congress can reduce spending as much as they want (or even eliminate programs entirely) by changing the annual appropriations bills that fund the federal government.
The question is, what programs are elected officials and their constituents willing to cut? The data we have shown here suggests that there are very few truly wasteful government programs that no one wants. Reducing spending will require true pain, where the government stops (or reduces funding for) programs that deliver benefits and receive public support. In this sense, cutting discretionary spending involves a benefit and a cost: lower spending, but also fewer government services.
One other important point made by these graphs is that discretionary spending is not the principal driver of overall federal spending or of the federal budget deficit. As we discuss in other policy briefs, the increases in recent years are driven by (a) tax cuts, (b) increased spending on entitlements and defense, and (c) spending on COVID-related assistance. In contrast, discretionary spending is not out of control; if anything, it has decreased in recent years.
For Further Reading
Congressional Budget Office (2022) Options for Reducing the Deficit, 2023 to 2032–Volume I: Larger Reductions, https://www.cbo.gov/publication/58164, accessed 6.6/23.
Kamarck, E. 2023. Why is federal spending so hard to cut – There’s a right way and a wrong way. The Brookings Institution, https://tinyurl.com/2xejud5w, accessed 6/6/23
Committee For a Responsible Federal Budget. 2023. Fix the National Debt. https://www.crfb.org/debtfixer, accessed 6/6/23
Policy vs. Politics 2023. National Debt/Debt Limit, available at www.policyvspolitics.org/national-debt-debt-limit-what-you-need-to-know/
Policy vs. Politics. 2023. Entitlements, available at www.policyvspolitics.org/entitlements-what-you-need-to-know
Policy vs. Politics. 2023. Balanced Budgets, available at www.policyvspolitics.org/balanced-budget-what-you-need-to-know/
Policy vs. Politics. 2023. Defense Spending, in-press.
Sources
What are the major components of discretionary spending?
Congressional Budget office. (202). Discretionary Spending Options. Congressional Budget Office, www.cbo.gov/content/discretionary-spending-options, accessed 4/1/23. (Chart Data)
Treasury Department. (2023) How much has the U.S. government spent this year? U.S. Treasury Fiscal Data, https://tinyurl.com/cse42azt, accessed 4/1/23.
Ready, D. et al. (2023) Discretionary Spending in Fiscal Year 2022: An Infographic. Congressional Budget Office, www.cbo.gov/publication/58890 , accessed 4/10/23. (Chart Data)
Has Discretionary Spending Increased Over Time?
Congressional Budget office. (202). Discretionary Spending Options. Congressional Budget Office, www.cbo.gov/content/discretionary-spending-options, accessed 4/1/23. (Chart Data)
What parts of domestic spending are smaller than the public believes?
Ingram, G. (2019) What Every American Should Know About US Foreign Aid. The Brookings Institution. https://tinyurl.com/mr2tsxtn, accessed 4/2/23
Van Green, T. (2023). Six Facts About Americans’ Views of Government Spending and the Deficit. Pew Research Center, https://tinyurl.com/n9mr8utm, accessed 5/23/23
How much of discretionary spending goes to “waste, fraud, and abuse”?
Citizens Against Government Waste. (2022) 2022 Congressional Pig Book. Available at www.cagw.org/reporting/pig-book, accessed 4/1 23.
Center on Budget and Policy Priorities. (2022) Policy Basics: Where Do Our Federal Tax Dollars Go? Center on Budget and Policy Priorities. https://tinyurl.com/2p9y9ewy , accessed 4/7/23.
How does federal discretionary spending compare to spending by state and local governments?
Urban Institute. (2023). State and Local Expenditures. The Urban Institute https://tinyurl.com/9n9bysm8, accessed 5/25/23
FRED Economic Data. (2023) State and Local Government Current Expenditures. St. Louis Federal Reserve Bank, https://fred.stlouisfed.org/series/ASLEXPND, accessed 6/3/23. (Chart data)
Can discretionary spending be reduced?
Pew Research Center. (2019) Little Public Support for Reductions in Federal Spending. https://tinyurl.com/y43tptje, accessed 4/3/23.
Kamarck, E. 2023. Why is federal spending so hard to cut – There’s a right way and a wrong way. The Brookings Institution, https://tinyurl.com/2xejud5w, accessed 6/6/23
This policy brief was researched and drafted in March-April 2023 by Politics vs. Policy Interns Riana Bucceri, Greta Filor, and Mary Stafford, and revised by Research Director Dr. William Bianco.