
For most people, being unemployed is a simple question: Do you have a job or not? Even so, measuring the unemployment rate for the entire nation is not simple. There are different ways to determine who is employed and who is not, and these measures can produce very different conclusions about the unemployment rate and the state of the U.S. economy.
What is the unemployment rate?
The formal definition of unemployment starts with estimating the labor force, people working or looking for work. This definition excludes people who are too young to work or have retired, people who are unable to work, and people who are not actively looking for a job, like those who choose to stay home to care for children. The number of unemployed includes only those who currently do not have a job, have actively looked for a job in the last four weeks, and can work.
To determine the unemployment rate, the number of unemployed individuals is divided by the number of people in the labor force. As of April 2024, the unemployment rate was 3.9%, or 6.5 million persons. The Bureau of Labor Statistics reported that teenagers currently have the highest unemployment rates among demographic groups, at 11.7% in April 2024.
What about under-employed people?
A low unemployment rate indicates good economic conditions, but it does not necessarily mean everyone is happy with their current job. An unemployment rate can be low, but only because of underemployment: people who are employed but are overqualified for their jobs or people who are employed in a part-time job but wish to be employed full-time. Including underemployed and part-time workers in the calculation increased the rate from 3.9% to 6.9% as of April 2024.
How has the unemployment rate varied over time?
The unemployment rate tends to follow the economy’s ups and downs. The economy has its cycles of expansion and contraction, and employment tends to follow this cycle. Unemployment rises with negative economic conditions as firms hire fewer workers or lay off current employees. Similarly, firms hire and recall workers when the economy grows and unemployment drops.
The figure below shows the yearly average unemployment rate since 1948. The plot shows that the U.S. has seen major spikes in unemployment during economic recessions, such as in the early 1980s and the Financial Crisis of 2008-2010. (See our Policy Brief on Inflation, linked in Further Reading, for more details.) The U.S. also saw a dramatic spike in unemployment during the early months of the COVID pandemic. However, the unemployment rate rapidly declined as the economy reopened and workers were called back to their jobs. Current unemployment rates are near all-time lows.
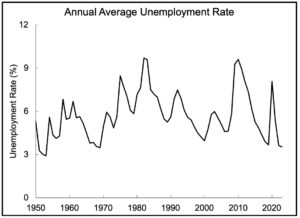
Source: BLS (2023)
As shown in the figure below, the unemployment rate for Blacks and Latinos is generally higher than that of White Americans (the figure shows the same annual average as the earlier plot, but for a shorter time frame). The causes of these racial differences are debated. Part of the answer lies in different levels of education, differences in where people live, and differences in the sectors they work in. For example, unemployment levels for Blacks in the Upper Midwest are about 3-5 times higher than for Whites. However, unemployment levels are very similar in states like West Virginia and Kentucky.
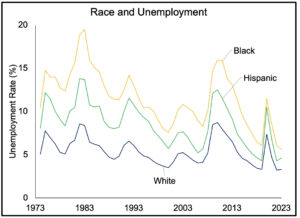
Source: BLS (2024a, 2024b, 2024c)
Do some states have higher unemployment rates than others?
The economies of American states vary significantly – they have different kinds of industries and businesses. As a result, unemployment levels can vary across states. One state may have industries growing strongly, while another may be dominated by industries with low growth or even declining. For example, during COVID, hospitality industries were particularly hard hit, so states like Nevada, whose economies depended on tourism, had much higher unemployment than others.
In the post-pandemic era, unemployment levels have been similar across states, as shown in the figure below for June 2023. Overall, there is only a 3.3 percentage point difference between the state with the highest unemployment rate (California, 5.3%) and the state with the lowest (North Dakota, 2.0%).
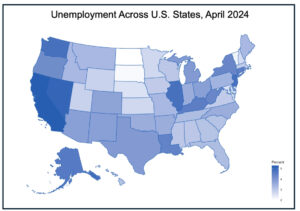
Source: BLS (2024d)
The Federal Reserve, tasked by Congress with maintaining a healthy economy, defines ‘Maximum Employment’ as an unemployment rate low enough that almost anyone wanting a job can find one and in which the inflation rate is relatively low and stabilized. While they do not make their precise targets public, most analysts believe that the Fed aims for 2% inflation and an unemployment rate of 4%.
It is important to remember that a low unemployment rate is not necessarily good economic news. Particularly after an economic downturn, many individuals may be underemployed. For example, while the overall unemployment rate in the 1990s was near historic lows as the economy surged, many of those in the industrial sector permanently lost their jobs as manufacturing was relocated abroad to take advantage of fewer regulations and lower wages. These individuals remained in the labor force but moved to lower-paying jobs. For more details see our Policy Brief on Offshoring.
Further Reading
Wolla, A. (2016) Making Sense of Unemployment Data. Page One Economics. http://tinyurl.com/mfvrj9wc, accessed 12/14/23.
Policy vs Politics Policy Brief: Inflation, https://tinyurl.com/2yrb7nbb
Policy vs Politics Policy Brief: Offshoring (TBD)
Bureau of Labor Statistics. (2024). Alternative Measures of Labor Underutilization. https://tinyurl.com/5end5u3f, accessed 5/8/2024
Sources
What is the unemployment rate?
Wolla, A. (2016) Making Sense of Unemployment Data. Page One Economics. http://tinyurl.com/mfvrj9wc, accessed 12/14/23.
Bercena, L. H. & Wessel, D. (2022). How does the Fed define “maximum employment”? Brookings Institute. http://tinyurl.com/vw25mfjb, accessed 12/14/23
Barnichon, R., & Zylberberg, Y. (2019). Underemployment and the Trickle-Down of Unemployment. American Economic Journal: Macroeconomics, 11(2), 40–78. https://www.jstor.org/stable/26621310, accessed 12/14/23.
What about people who are under-employed?
Bureau of Labor Statistics. (2024). Employment Situation Summary. http://tinyurl.com/3w4z7z72, accessed 5/8/2024.
Bureau of Labor Statistics. (2024). Alternative Measures of Labor Underutilization. https://tinyurl.com/5end5u3f, accessed 5/8/2024
How has the unemployment rate varied over time?
U.S. Bureau of Labor Statistics, Unemployment Rate. (2023). Retrieved from FRED, Federal Reserve Bank of St. Louis. https://fred.stlouisfed.org/series/UNRATE, accessed 12/14/23. (Chart Data).
Handwerker, E. W. Meyer, P. B, Piacentini, J. Schultz, M. & Sveikauskas, L. (2020). Employment recovery in the wake of the COVID-19 pandemic. Monthly Labor Review, 1–24, https://www.jstor.org/stable/26976378, accessed 4/22/24.
Ritter, J. and Taylor, L. (2011) “Racial Disparity in Unemployment” The Review of Economics and Statistics 93(1): 30-42. https://www.jstor.org/stable/23015918, accessed 12/14/23.
U.S. Bureau of Labor Statistics, Unemployment Rate – White. (2024). Retrieved from FRED, Federal Reserve Bank of St. Louis. https://fred.stlouisfed.org/series/LNS14000003, accessed 2/6/24. (Chart Data)
Emeka, A. (2017). Where Race Matters Most: Measuring the Strength of Association between Race and Unemployment Across the 50 United States. Social Indicators Research, 136(2): 557-573. https://www.jstor.org/stable/48715734, accessed 12/14/23.
U.S. Bureau of Labor Statistics, Unemployment Rate – Black or African American. (2024a). Retrieved from FRED, Federal Reserve Bank of St. Louis. https://fred.stlouisfed.org/series/LNS1400000, accessed 2/6/24. (Chart Data).
U.S. Bureau of Labor Statistics, Unemployment Rate – Hispanic or Latino. (2024b). Retrieved from FRED, Federal Reserve Bank of St. Louis.https://fred.stlouisfed.org/series/LNS14000009, accessed 2/6/24. (Chart Data).
Weinstock, L. (2023). Introduction to the US Economy: The Business Cycle and Growth. Congressional Research Service Report. http://tinyurl.com/yj868jka, accessed 12/14/23.
Do some states have higher unemployment rates than others?
Reeves, R. Welch, M. & Van Drie, H. (2021). ‘You never know’: Work and precarity in Las Vegas before and during COVID-19. Brookings Institute. http://tinyurl.com/bddr2bfr, accessed 12/14/23.
United States Bureau of Labor Statistics. (2024d). State Employment and Unemployment (Monthly) News Release. http://tinyurl.com/ms5ka74s, accessed 2/6/24. (Chart Data).
What is a “good” unemployment rate?
Federal Reserve. (2020). What economic goals does the Federal Reserve seek to achieve through its monetary policy? https://tinyurl.com/mw68pmtn, accessed 5/9/24.
Bercena, L. H. & Wessel, D. (2022). How does the Fed define “maximum employment”? Brookings Institute. http://tinyurl.com/vw25mfjb, accessed 12/14/23.
Mitra, D. & Ranjan, P. (2010). “Offshoring and Unemployment: the Role of Search Frictions and Labor Mobility” Journal of International Economics 81(2): 219-229. http://tinyurl.com/43e29ya8, accessed 12/14/23.
Contributors
Julia Acevedo (Intern) is a Political Science and Public Policy double major at Susquehanna University and is expected to graduate in May 2024 and pursue a Masters degree in Public Health.
Elijah Oaks (Intern) is a student at Dartmouth College. He is expected to graduate in May 2024 with a major in English and a minor in Religion. He is a Policy Fellow at The Cicero Institute.
Dr. Laura Bucci (Subject Matter Expert) is an Associate Professor of Political Science at Saint Joseph’s University. Her research focuses on how labor decline/resurgence influences political behavior, public policy, and state politics. She received her PhD from Indiana University.
Dr. Robert Holahan (Content Lead) is Associate Professor of Political Science and Faculty-in-Residence of the Dickinson Research Team (DiRT) at Binghamton University (SUNY). He holds a PhD in Political Science in 2013 from Indiana University, where his advisor was Nobel Laureate Elinor Ostrom.
Dr. William Bianco (Research Director) received his PhD in Political Science from the University of Rochester. He is Professor of Political Science and Director of the Indiana Political Analytics Workshop at Indiana University. His current research is on representation, political identities, and the politics of scientific research.
Publication Log
Published 6/11/24